Exploring U.S. Mortgages: Key Statistics and Trends
In 2023, mortgages in the United States presented a complex yet insightful picture.
Understanding these trends is crucial for industry players, policymakers, and consumers amid economic fluctuations and changing demographics. This article delves into the pivotal statistics that shaped the mortgage market last year.
Table of Contents
- Personal Debt and Home Loans
- Home Equity Credit Lines
- Typical Home Interest Rate
- New Mortgages
- Mortgage Amounts
- Mortgage Money Problems
- Evolving Patterns: The Changing Face of Homeownership
- A Demographic Breakdown of Today’s Homeowners
- Conclusion
Total Mortgages and Debt
In the dynamic landscape of U.S. financial obligations, mortgage debt is increasingly prominent.
- Americans have 84 million mortgages and owe a staggering $12.14 trillion.
- The total mortgage debt is up from $12.01 trillion in the previous quarter. This represents a quarterly increase of 1.05%.
- Compared to the same period one year ago, when the mortgage debt was $11.67 trillion, there has been a 4.04% increase.
- The total household debt reached $17.29 trillion in Q3 of 2023. Of this amount, mortgage balances rose by $126 billion.
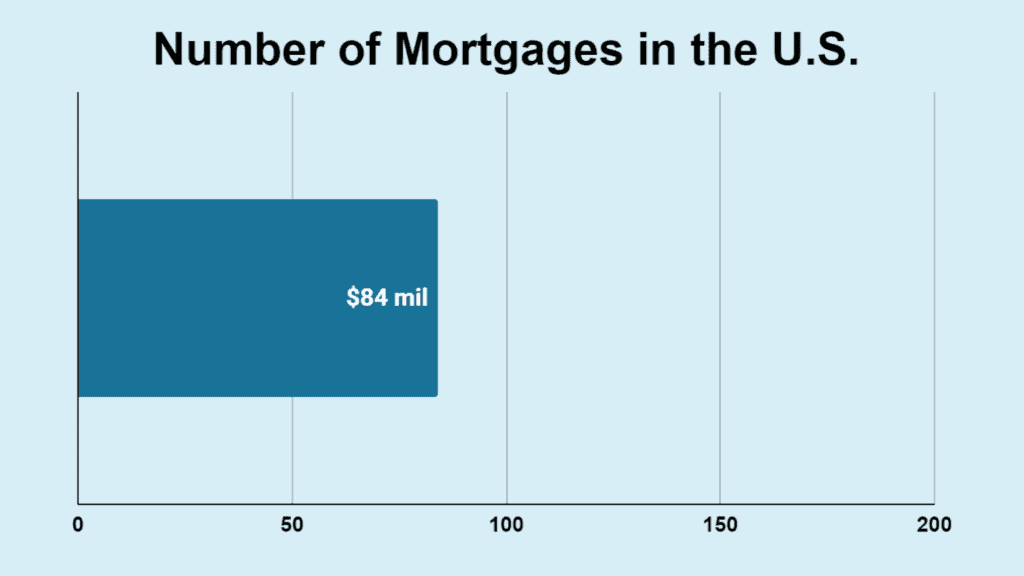
This figure underscores mortgages as the dominant component (70.2%) of consumer debt in the U.S.
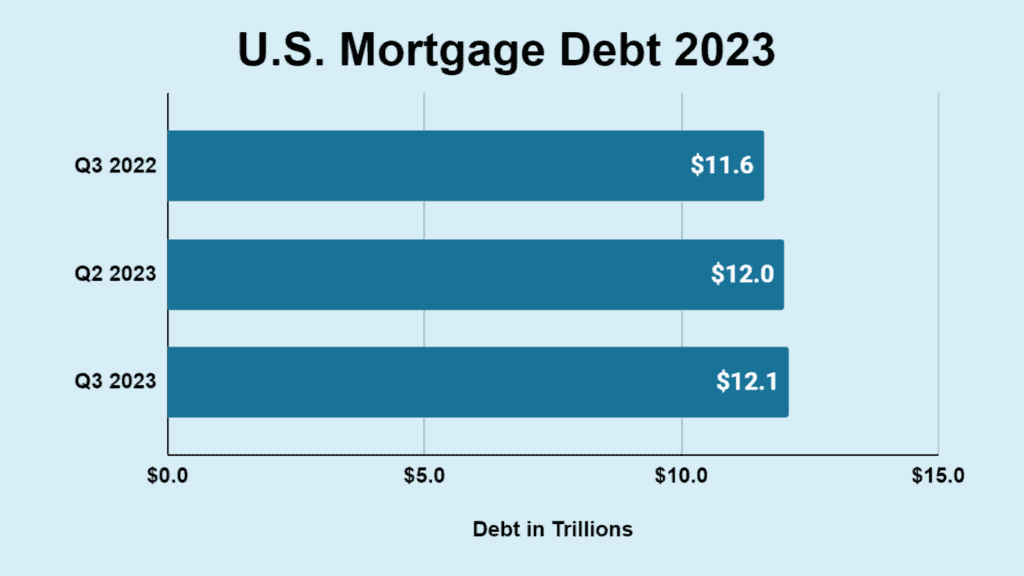
| Time Period | Debt in Trillions | Increase |
|---|---|---|
| Third Quarter 2022 | $11.67 | |
| Second Quarter 2023 | $12.01 | 1.05% |
| Third Quarter 2023 | $12.14 | 4.04% |
Sources: New York Fed, Y Charts, Lending Tree
Home Equity Lines of Credit
While mortgages dominate the U.S. debt landscape, the role of Home Equity Lines of Credit (HELOCs) is also notable.
- HELOCs also play a significant role, with Americans owing $349 billion on 13.1 million accounts.
- As of Q2 2023, the average HELOC balance per account was $25,974, with an average credit limit of $69,519 per account. On average, HELOC account owners utilized 37% of their available credit. The total credit limits for all HELOC accounts amounted to $910 billion.
- There was a substantial drop in HELOC activity in the first half of 2023 compared to the previous year. Lenders initiated over 645,000 new HELOCs, amounting to almost $98 billion. This represents a 26% decrease in HELOC counts and a 32% reduction in amounts compared to the previous year.
Sources: Lending Tree, MoneyGeek, CoreLogic
Average Interest Rate
The mortgage market in 2023 was marked by variable interest rates, especially for 30-year fixed mortgages.
- The average interest rate for a 30-year fixed mortgage stood at 6.79% in 2023.
- The interest rates for 30-year fixed mortgages fluctuated weekly throughout 2023. The rate started at 6.48% on January 5th, 2023, and moved to a low of 6.09% on February 2nd, 2023. The highest rate was recorded at 7.79% on October 26th, 2023.
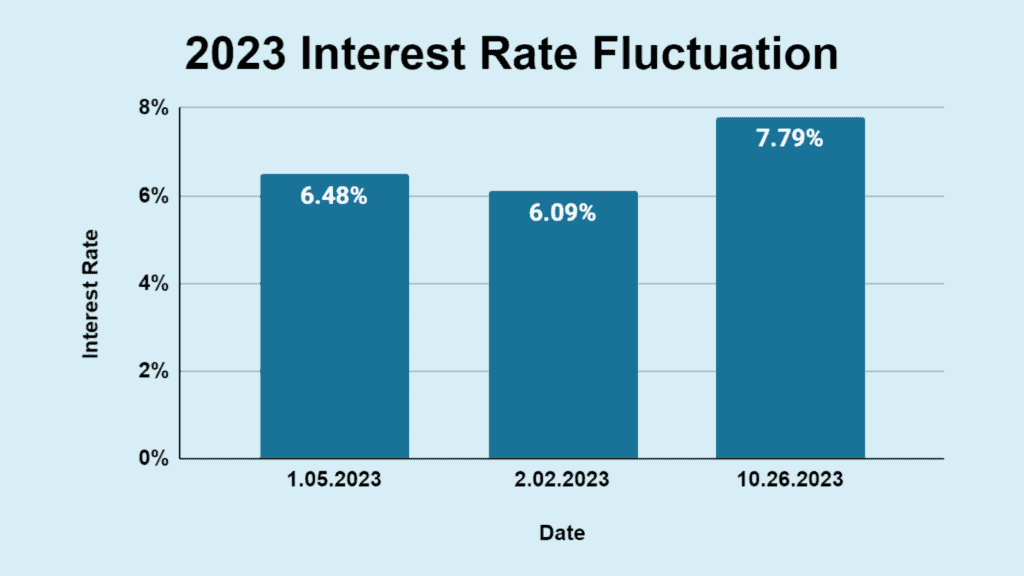
| Date | Mortgage Interest Rate |
|---|---|
| January 5, 2023 | 6.48% |
| February 2, 2023 | 6.09% |
| October 26, 2023 | 7.79% |
Broader economic factors influence the dynamic nature of mortgage rates within the year.
Sources: PropertyCalcs, Lending Tree
New Mortgage Debt
The mortgage landscape in 2023 saw a substantial influx of new debt, with key trends emerging in borrower credit quality and overall loan origination dynamics.
- $1.1 trillion in new mortgage debt was originated in just the first three quarters of 2023.
- 77.4% was issued to super-prime borrowers with credit scores of at least 720. In contrast, only 3.6% of the new mortgage debt was issued to subprime borrowers with scores below 620.
- In the first quarter of 2023, there were 1.25 million mortgage originations, down 19% from the previous quarter, 56% year-over-year, and 70% from the peak in Q1 2021. This significant drop in mortgage originations reflects the impact of rate hikes and persistently high inflation in 2022 and 2023.
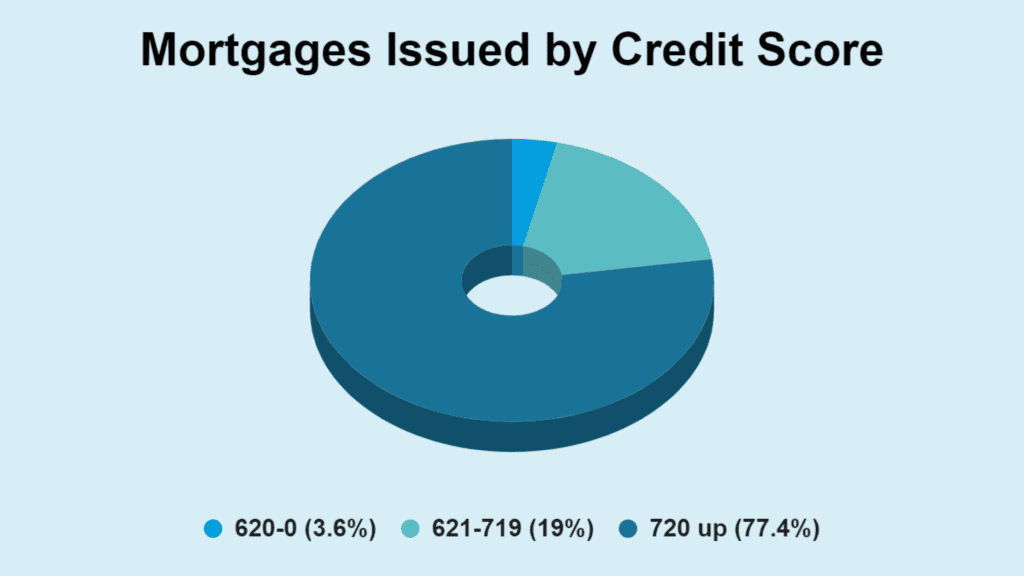
| Credit Score | % of Mortgages Issued |
|---|---|
| 720 and higher | 77.4% |
| 719-621 | 19% |
| 620 and below | 3.6% |
Sources: Mortgage Calculator, Lending Tree
Average Home Purchase Mortgage
The diversity in the U.S. housing market is evident in the varied average mortgage sizes and regional trends in home purchasing.
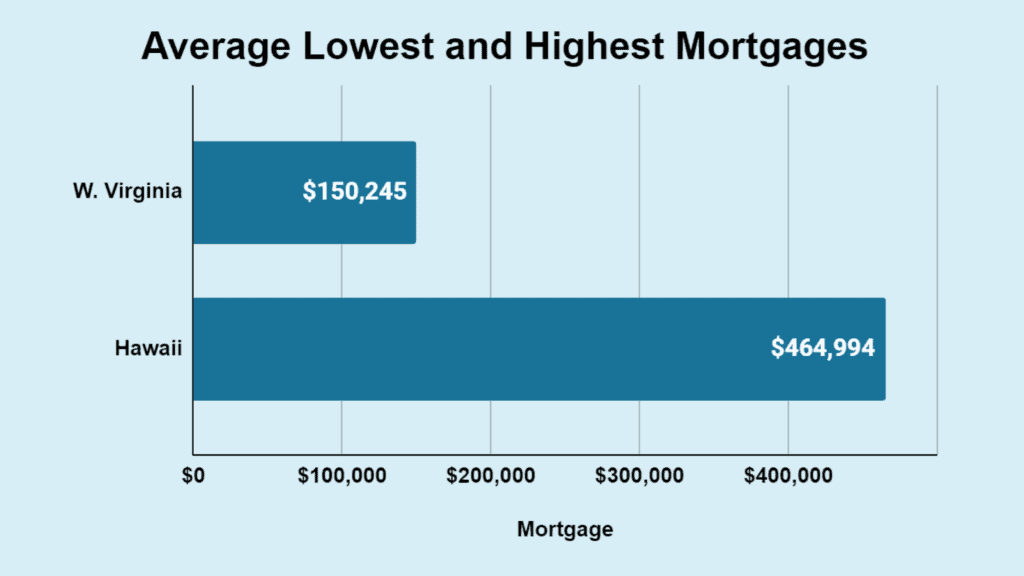
- Reflecting regional disparities, the average size of a home purchase mortgage varied significantly across states, from $150,245 in West Virginia to $464,994 in Hawaii.
- Utah, Colorado, Idaho, and South Carolina were noted for having the highest number of mortgages taken out for primary home residences, as opposed to investment properties.
| Amount of Mortgage | State |
|---|---|
| $150,245 | West Virginia |
| $464,994 | Hawaii |
Source: Lending Tree, American Home Shield
Delinquency and Foreclosure Rates
In August 2023, the U.S. housing market faced challenges, with a notable percentage of mortgages either seriously delinquent or in a state of foreclosure, alongside a fraction of properties being underwater financially.
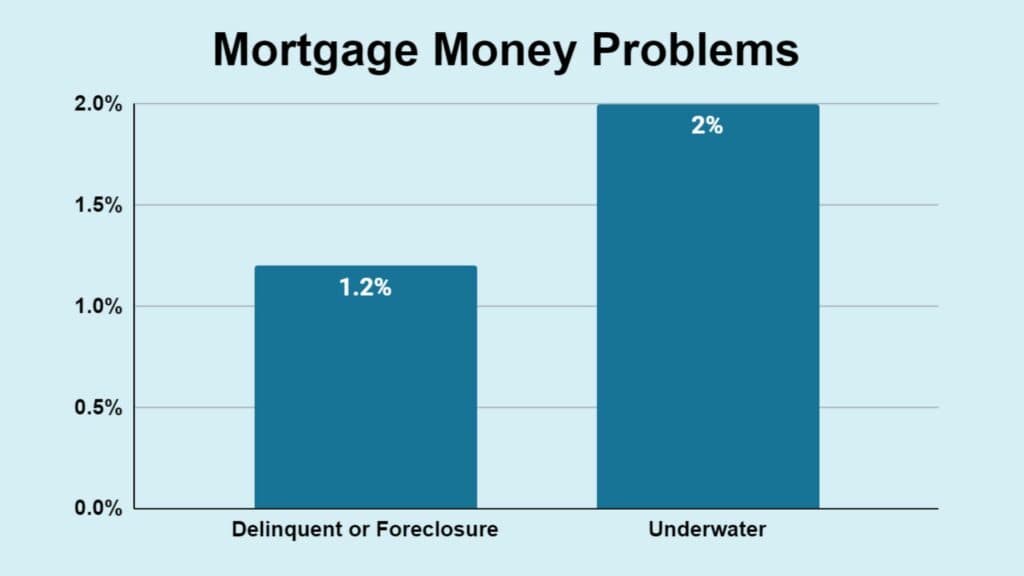
- 1.2% of mortgages were seriously delinquent or in foreclosure as of August 2023.
- 2.0% of mortgages owe more than the property’s worth.
| Mortgage Issue | % of Mortgage Holders |
|---|---|
| Delinquent Payments or in Foreclosure | 1.2% |
| Owe More Than the Home is Worth | 2% |
Source: Lending Tree
Homeownership Trends
The story of homeowners in the U.S. has evolved significantly, marked by distinct trends and changes over the past decade.
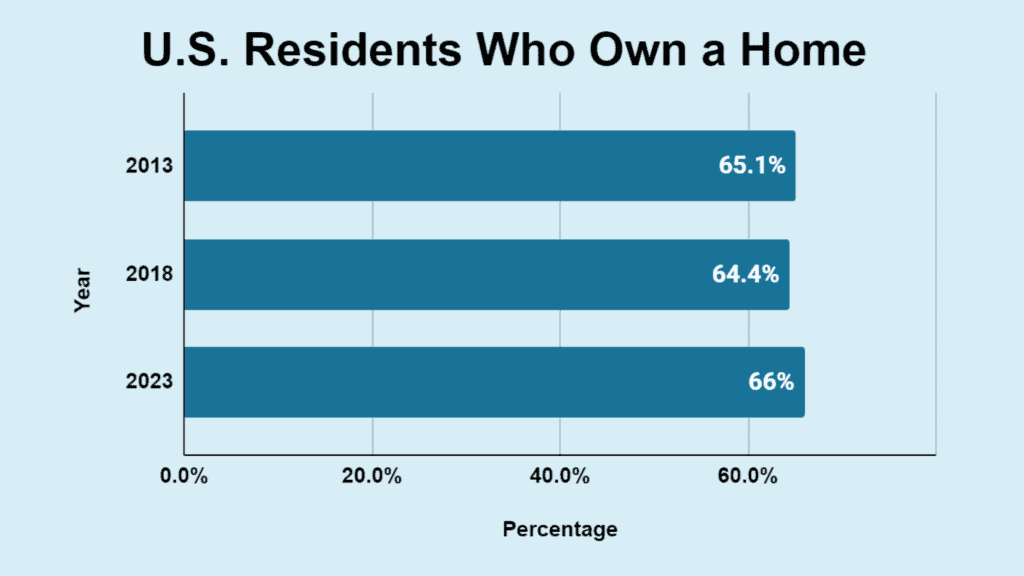
- The homeowner rate in the U.S. stood at 66% in 2023.
- In 2018, the homeownership rate in the U.S. was 64.4%.
- Ten years ago, in 2013, this rate was slightly higher, at 65.1%.
| Year | Percentage |
|---|---|
| 2023 | 66% |
| 2018 | 64.4% |
| 2013 | 65.1% |
Source: Yahoo! Finance, DQYDJ, iProperty Management
Demographic Insights
The demographics of U.S. homebuyers present a diverse picture, highlighting age variations between first-time and repeat buyers, as well as distinct ownership trends across racial groups.
Moreover, the pattern of single homeownership showcases a striking gender contrast, particularly emphasizing the role of single women in the real estate market.
- The typical first-time homebuyer was 36 years old, while repeat buyers averaged 59 years.
- Homeowners differed markedly by race, with Caucasian households leading, followed by Asian, Hispanic, and Black households.
- In 2023, single women comprised 17% of all home buyers, compared with 9% of single men.
- A report indicated that single women own about 10.76 million homes, while single men own about 8.12 million in the 50 states. Single women own an average of 12.9% of the owner-occupied homes versus 10.06% among single men.
- In 2022, single women owned 58% of the nearly 35.2 million homes owned by unmarried Americans, while single men held 42%.

| Age | |
|---|---|
| 36 | First-Time Homebuyer |
| 59 | Repeat Homebuyer |

| Homeowner | Percentage |
|---|---|
| Female | 17% |
| Male | 9% |
Sources: Homebuyer, Morningstar, RiseMedia, Lending Tree, Pew Research Center
Conclusion
The U.S. mortgage market in 2023 was a tapestry of diverse trends influenced by economic conditions, demographic shifts, and policy changes. These statistics illuminate the current state and pave the way for future insights and strategies in this vital sector.
Further Insights
The intricacies of the U.S. mortgage market reflect the broader housing landscape in the country. For a comprehensive understanding of this landscape, it is essential to consider the various forms of homeownership. The tiny home movement also presents an alternative approach to traditional homeownership, gaining popularity for its affordability and sustainability.