In 2023, the American housing market’s landscape was marked by dynamic changes, yet homeownership remains a key economic goal.
This article explores the latest homeownership statistics in the U.S., shedding light on the demographics, economics, and societal shifts shaping this vital part of the American experience.
Contents:
- Homeowners in the U.S.
- Homeowner Consistency
- What is the Age of the Average Homeowner?
- Ethnic Disparity
- Owner-Occupied Housing
- Stats for Homeowner States
- Top States to Have a House
- States With the Fewest Homeowners
- Changes in Housing Priorities
- Homeowners – More Men or Women?
- Conclusion
U.S. Rate for Homeowners Stands Strong
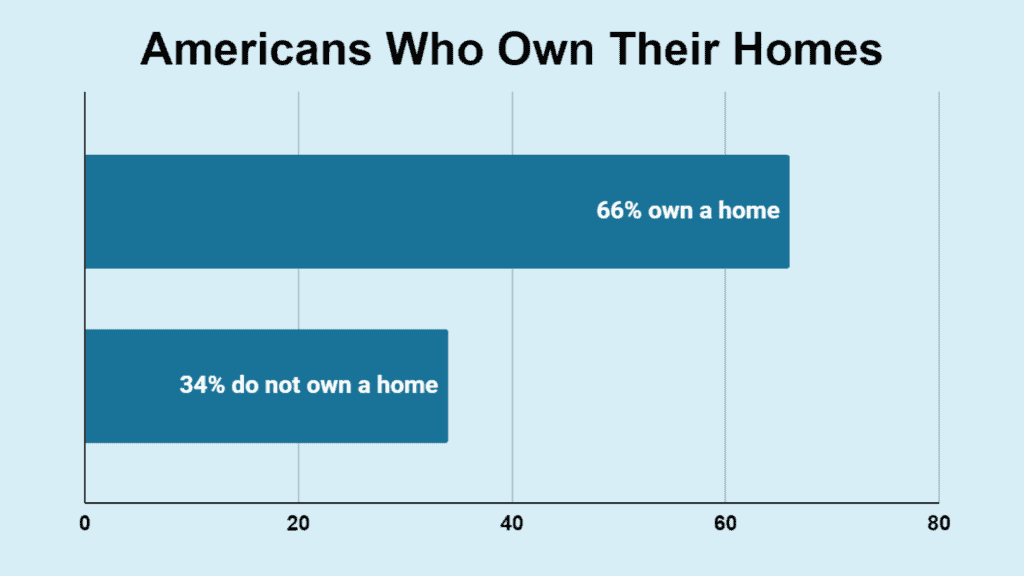
- In the first quarter of 2023, reports showed that 66% of Americans were homeowners.
- 64% of Americans own real estate, including primary residences, vacation homes, and investment properties.
- The U.S. sees a significant portion of its rental properties owned by individuals, with 72.5% of rental property investors being private individuals.
- About 7,690,000 new homes were sold in 2022. As of May 2023, the annual number of single-family and condo or co-op transactions in the U.S. stood at 4.3 million. This figure reflects the market activity for the first five months of the year. It indicates a cooling down from the previous year.
- 34% of Americans do not own their home, opting instead for rental housing.
| Percentage | |
|---|---|
| Americans Owning a Home | 66% |
| Americans Not Owning a Home | 34% |
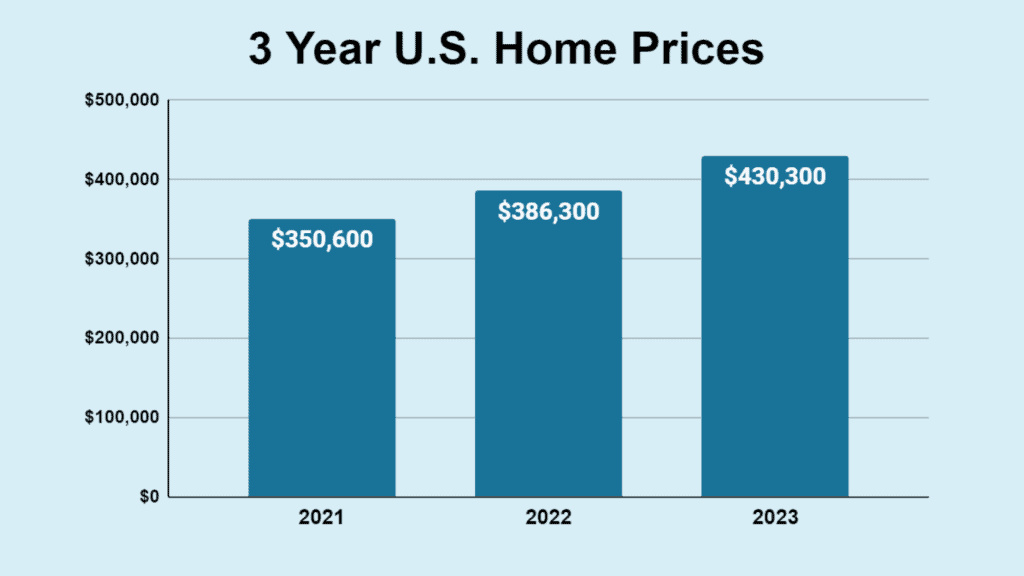
The average home price in 2022 was $386,300, up 10.2% from $350,635 in 2021. This increase points to a trend of rising property values. As of the third quarter of 2023, it was $430,300. This represents a 3% increase from the second quarter of the same year.
| Year | Home Cost |
|---|---|
| 2021 | $350,600 |
| 2022 | $386,300 |
| 2023 | $430,300 |
Sources: Bankrate, The Zebra, Picasso, Today’s Homeowner, Statista, The Motley Fool
Decades of Consistent Homeownership
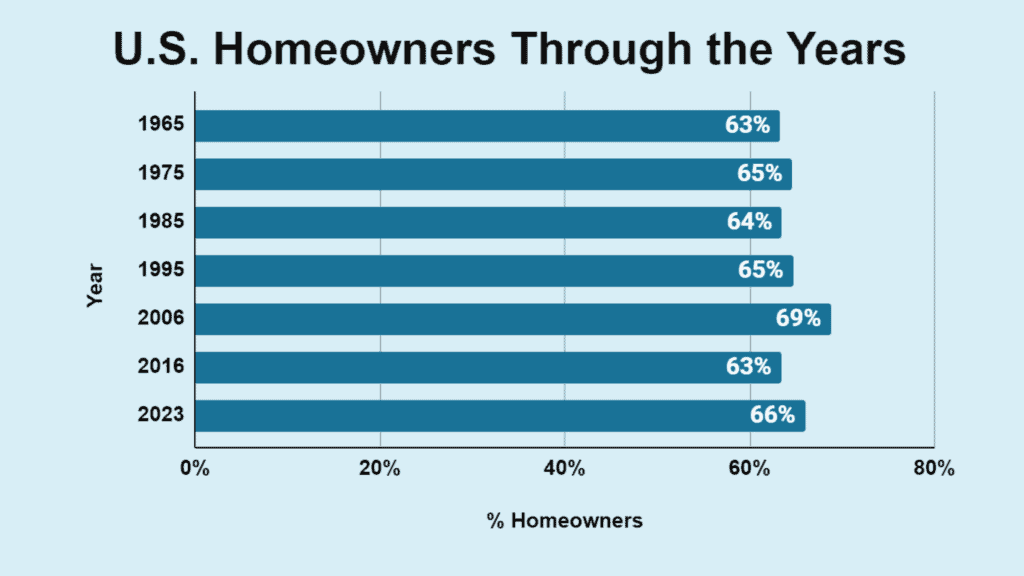
The U.S. homeownership rate has remained virtually the same over the past 58 years, maintaining a range between 63% and 69%. This demonstrates the enduring appeal of homeownership across generations despite economic cycles and changing market conditions.
| Year | U.S. Residents Who Owned a Home |
|---|---|
| 1965 | 63% |
| 1975 | 64.6% |
| 1985 | 63.5% |
| 1995 | 64.7% |
| 2006 | 68.8% |
| 2016 | 63.4% |
| 2023 | 66% |
Source: RubyHome
Homeowner Age
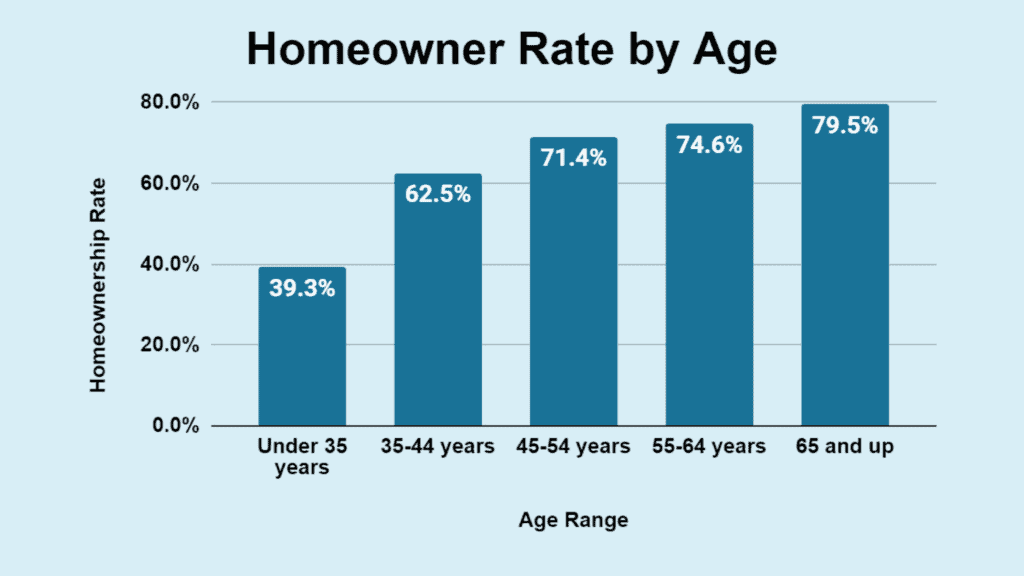
In the first quarter of 2023, the homeownership rate for households aged 65 and older rose to 79.5% from 78.6% in 2022. This indicates a slight increase and reflects the higher likelihood of homeownership within this age group.
This statistic underscores the correlation between age and homeownership, with older Americans more likely to own their homes outright, benefiting from years of equity growth.
Only 39.3% of individuals under 35 are homeowners, indicating a significant generational gap in property ownership. This low percentage points to the barriers younger generations face, such as high student debt and rising home prices.
| Age | Homeowner Percentage |
|---|---|
| 65 and older | 79.5% |
| 55-64 | 74.6% |
| 45-54 | 71.4% |
| 35-44 | 62.5% |
| Under 35 | 39.3% |
Source: Movity, Eye on Housing, The Wood Group of Fairway
Ethnic Disparities in Homeownership
In the third quarter of 2023, the homeownership rate for non-Hispanic whites in the United States was reported at 74.5%. This represents a slight increase from the 74.4% reported in 2022.
The percentage of African-American homeowners stood at 45.5%, and Asian, Native Hawaiian, and Pacific Islanders was 62.7%. About 49.4% of Hispanic or Latino individuals were homeowners.
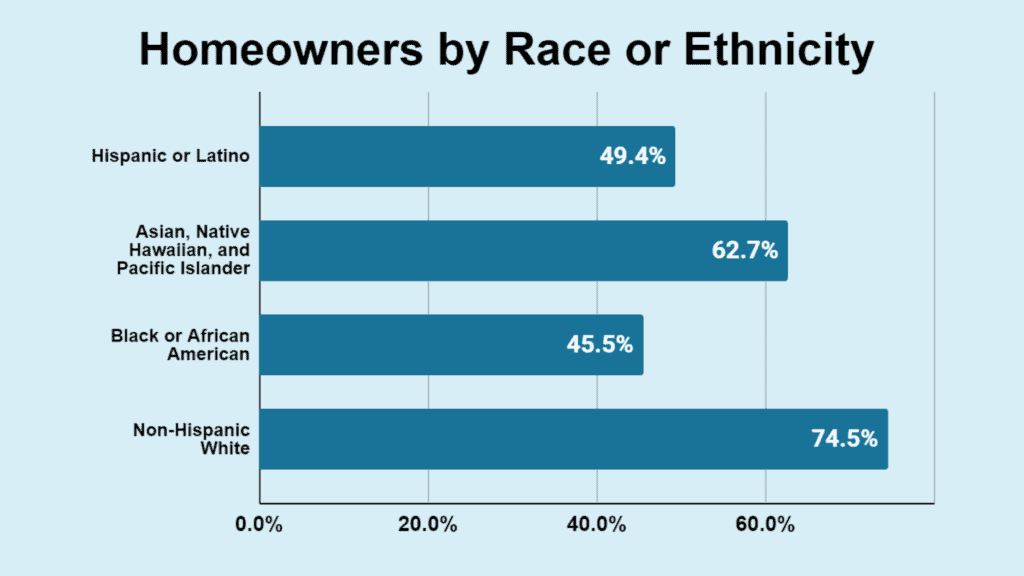
| Race/Ethnicity | Homeowner Rate |
|---|---|
| Non-Hispanic White | 74.5% |
| Black or African-American | 45.5% |
| Asian, Native Hawaiian, Pacific Islander | 62.7% |
| Hispanic or Latino | 49.4% |
Sources: U.S. Census Bureau, FRED
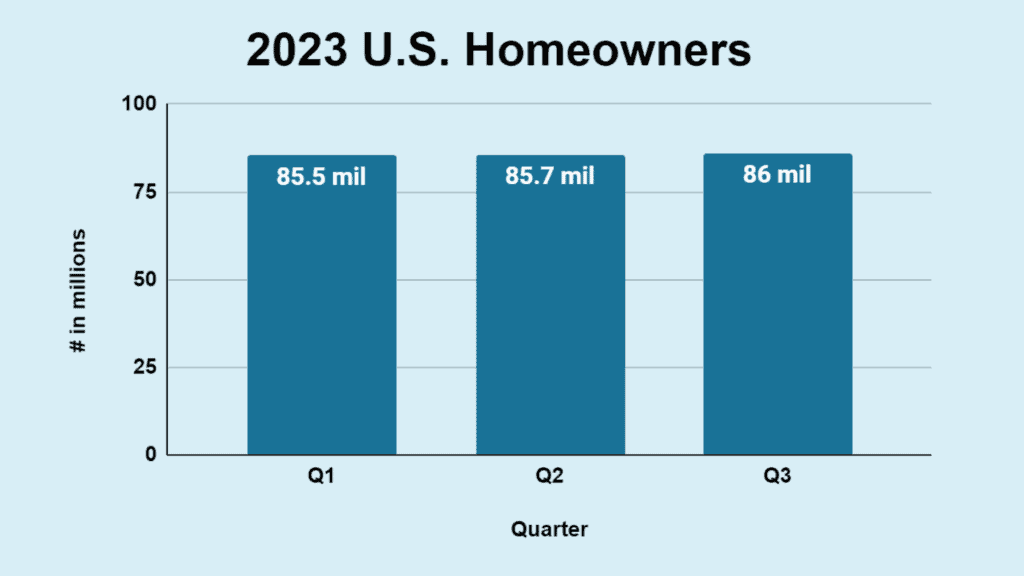
Growth in Owner-Occupied Households
As of the third quarter of 2023, there were 86 million owner-occupied housing units in the United States. This figure represents a slight increase each quarter from 85.5 million in Q1 2023 and 85.7 million in Q2 2023.
| Quarter of 2023 | Homeowners |
|---|---|
| Q1 | 85.5 million |
| Q2 | 85.7 million |
| Q3 | 86 million |
Sources: FRED | St. Louis Fed, Increditools
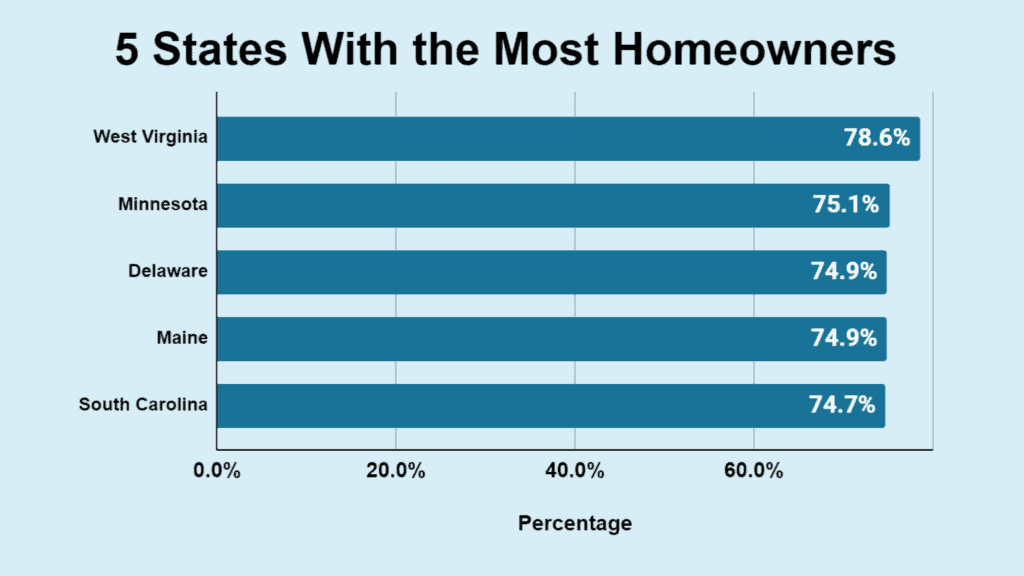
States With More Homeowners in 2023
The top 5 states with the highest homeownership rates in 2023 was:
- West Virginia – 78.6%
- Minnesota – 75.1%
- Delaware – 74.9%
- Maine – 74.9%
- South Carolina – 74.7%
These percentages represent the proportion of households owner-occupied in each state, indicating a high level of homeownership relative to other states.
| Place | State | Percentage |
|---|---|---|
| 1 | West Virginia | 78.6% |
| 2 | Minnesota | 75.1% |
| 3 | Delaware | 74.9% |
| 4 | Maine | 74.9% |
| 5 | South Carolina | 74.7% |
Source: Bankrate
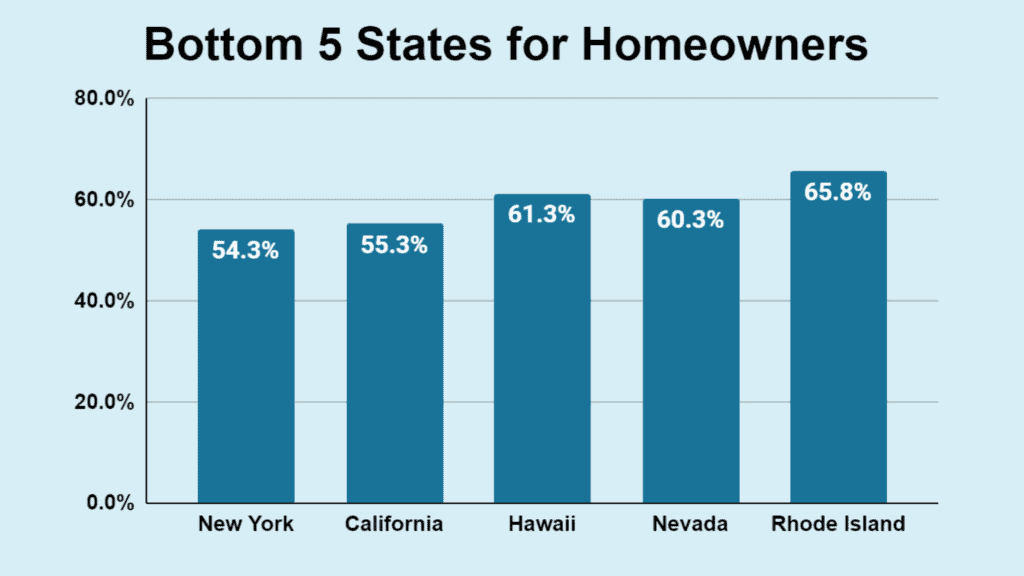
States With the Least Number of Homeowners
The states with the fewest homeowners are:
- New York – 54.3%
- California – 55.3%
- Hawaii – 61.3%
- Nevada – 60.3%
- Rhode Island – 65.8%
| Place | State | Homeowner Percentage |
|---|---|---|
| 46 | Rhode Island | 65.8% |
| 47 | Hawaii | 61.3% |
| 48 | Nevada | 60.3% |
| 49 | California | 55.3% |
| 50 | New York | 54.3% |
Source: FRED
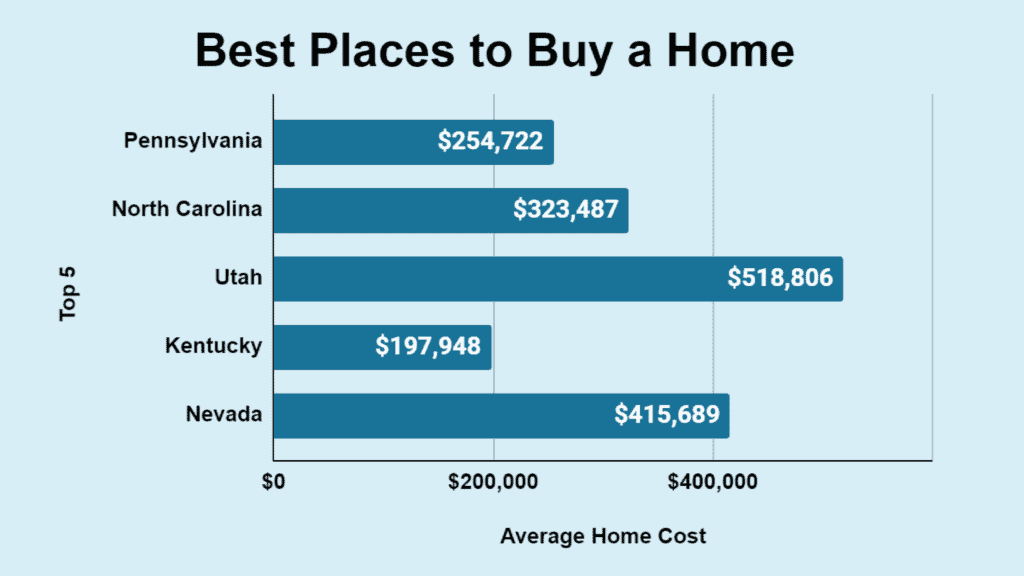
Best States to Buy a House
Considering factors like average home value and market conditions, the best states to purchase a home are:
- Pennsylvania has an average home value of $254,722. It is favored for homeownership due to its affordability and market conditions.
- North Carolina’s average home value is $323,487, and it is known for its growing housing market.
- Utah – The average home price stands at $518,806. The state’s strong economy and quality of life contribute to its high ranking.
- Kentucky is one of the most affordable states for homeownership, with an average home value of $197,948.
- Nevada has an average home price of $415,689 and offers a dynamic housing market, especially in areas like Las Vegas.
| State | Home Cost |
|---|---|
| Pennsylvania | $254,722 |
| North Carolina | $323,487 |
| Utah | $518,806 |
| Kentucky | $197,948 |
| Nevada | $415,689 |
These states were considered some of the best places to buy a house in 2023, reflecting a combination of affordability, economic health, and quality of living that appeal to homeowners.
Source: District Lending
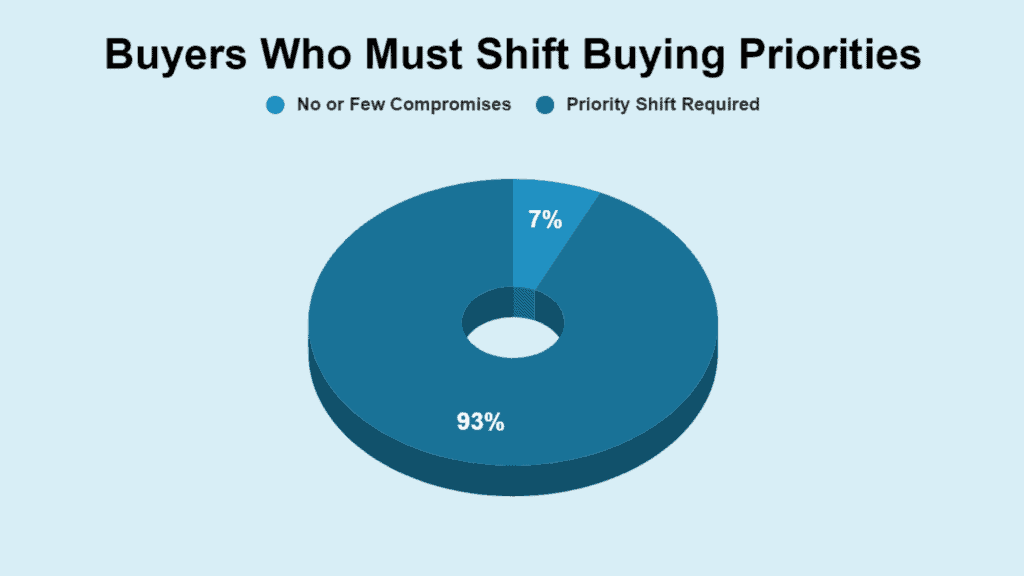
Home Buyers Face Compromises
The home-buying process in 2021 revealed that 80% of purchasers had to compromise on their initial priorities. This statistic reflects the competitive nature of the real estate market and the tough decisions buyers often face.
In 2023, nearly all recent home buyers (93%) compromised on their initial priorities, increasing from 80% in 2022. This statistic suggests an even more competitive real estate market where buyers frequently have to adjust their expectations to secure a home.
| Home Buyer | Compromise Priorities |
|---|---|
| Buyers Who Compromise | 93% |
| Buyers Who Don’t Compromise | 7% |
Sources: List With Clever
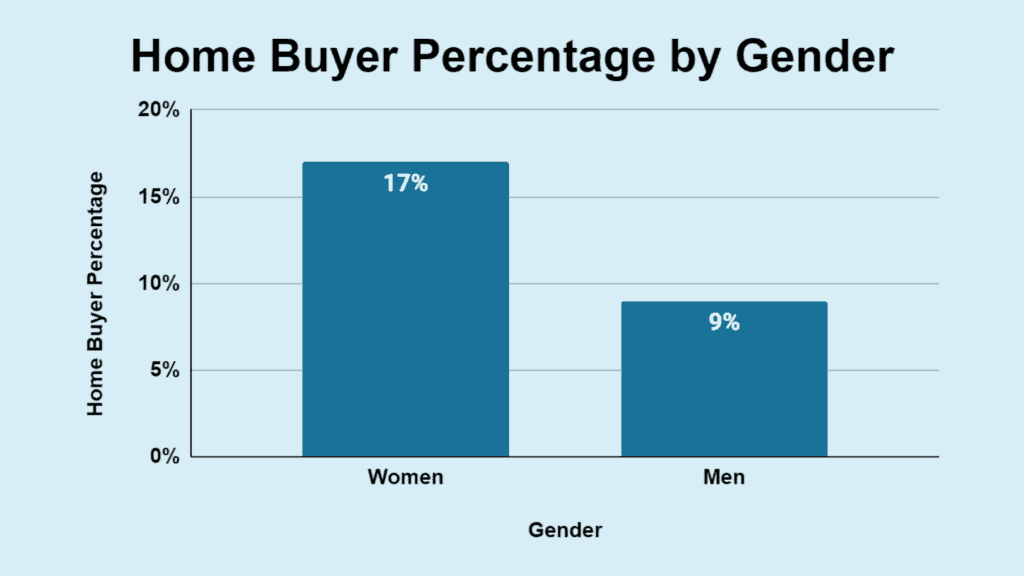
Gender Dynamics in Homeownership
More single women own homes compared to single men, highlighting a notable gender gap within the housing market. This trend points to changing societal norms and the increasing financial independence of women, which is an essential factor in the housing market.
In 2023, single women made up 17% of all homebuyers, while single men accounted for just 9%. This indicates that nearly twice as many single women are buying homes as their male counterparts, highlighting the significant gender dynamic within the housing market.
| Gender | % Home Buyers |
|---|---|
| Single Men | 9% |
| Single Women | 17% |
Each of these statistics offers a snapshot of the complex and evolving landscape of homeownership in the United States and provides a multifaceted picture of the market in 2023.
Sources: FinMasters, Bankrate
Conclusion
The 2023 statistics reflected a complex narrative of homeownership in the United States, influenced by age, ethnicity, gender, and many economic factors.
As the market responds to a new set of challenges and opportunities, these figures not only highlight the current state of housing but also signal potential pathways for future homebuyers.
Understanding these trends is essential for policymakers, industry stakeholders, and consumers alike as they make informed decisions in a landscape that continues to evolve.
Further Housing Insights
As we reflect on the complexities of homeownership in the United States, we must consider other critical factors. The housing market is not just about those who own homes; it’s also about those who rent. Exploring the rental market provides valuable insights, as well. Discover a broader picture of the diverse and dynamic U.S. housing market, reflecting the challenges and opportunities Americans face today.